SMT Line Capacity Planning for High-Volume PCBA Production
Introduction
SMT line capacity planning is the process of determining how much a surface mount technology (SMT) assembly line can produce within a defined period, identifying production constraints, and aligning manufacturing resources with customer demand. For high-volume printed circuit board assembly (PCBA), effective planning helps manufacturers manage delivery schedules, control production costs, and maintain consistent product quality.
Relying solely on the rated speed of pick-and-place machines can lead to inaccurate capacity estimates. Actual output depends on the entire production process, including solder paste printing, component placement, reflow soldering, automated optical inspection (AOI), changeovers, equipment availability, and product complexity.
For electronics manufacturers and buyers working with an electronics manufacturing services (EMS) provider, understanding these factors is essential to evaluating production capability and planning a reliable manufacturing program.
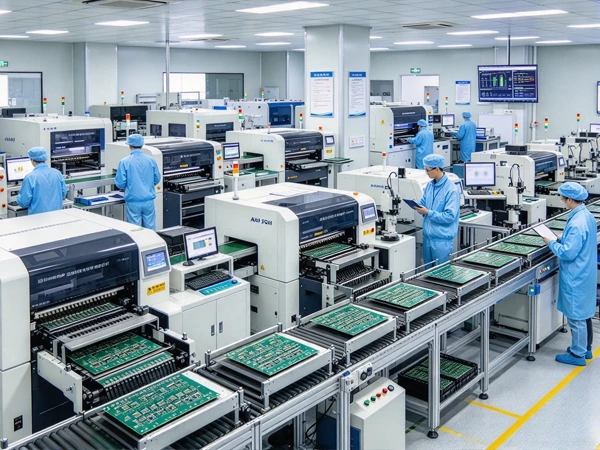
TECOO operates 8 production lines with a monthly placement capacity of 48.2 million component placements. This capacity provides a foundation for supporting a range of PCBA manufacturing requirements. Actual output for an individual project depends on its bill of materials (BOM), PCB design, process requirements, production schedule, and quality specifications.
This guide explains the key metrics, calculation methods, bottleneck analysis, and practical improvement strategies involved in SMT line capacity planning.
1. What Is SMT Line Capacity Planning?
SMT line capacity planning is the engineering process of matching available production resources with the required manufacturing output. It considers equipment performance, process cycle times, product mix, changeover requirements, planned maintenance, and quality performance.
The goal is not simply to maximize machine speed. It is to establish a realistic production plan that meets customer demand while maintaining process stability and product quality.
Effective SMT capacity planning typically involves:
- Demand analysis: Define the required number of boards, delivery dates, and production schedule.
- Process mapping: Identify each production stage and measure its cycle time.
- Capacity calculation: Estimate theoretical and effective throughput using consistent units.
- Bottleneck identification: Determine which process or shared resource constrains output.
- Resource allocation: Balance equipment, operators, fixtures, materials, and production shifts.
- Continuous improvement: Monitor production performance and update capacity estimates when conditions change.
Capacity planning should be reviewed when product designs change, production volumes increase, new products enter the schedule, or actual performance differs from the original plan.
2. Key Metrics for SMT Line Capacity Planning
Four important metrics are Components Per Hour (CPH), Units Per Hour (UPH), takt time, and Overall Equipment Effectiveness (OEE). Each describes a different aspect of production performance.
2.1 Components Per Hour (CPH)
CPH measures the number of component placements a pick-and-place machine can perform per hour. Equipment manufacturers commonly publish rated placement speeds under specified operating conditions.
However, rated CPH does not directly represent the number of completed PCBs produced by an entire SMT line. Actual placement performance depends on factors such as:
- Component package sizes and shapes
- The proportion of small passive components and complex ICs
- Feeder arrangement and component presentation
- Placement accuracy and vision-system requirements
- Nozzle selection and head movement
- Board dimensions and placement program optimization
- Component pickup errors and machine interruptions
For example, two PCB assemblies with the same number of components may require different placement times because their component mixes and placement layouts differ.
When estimating capacity, use machine specifications as an initial reference and validate them against the actual PCB design, placement program, and production data.
2.2 Units Per Hour (UPH)
UPH measures the number of completed units produced per hour. In PCBA manufacturing, it is important to define whether a unit means an individual PCB, a panel containing multiple PCBs, or a completed assembly.
For a simplified process in which one PCB is completed per production cycle:
Theoretical UPH = 3,600 ÷ Cycle Time in Seconds
For example, if the limiting process completes one PCB every 30 seconds:
Theoretical UPH = 3,600 ÷ 30 = 120 boards per hour.
If each production cycle processes a panel containing four identical boards, and the process can maintain the same cycle time, the theoretical output could be 480 boards per hour at that stage. The actual line output may be lower if another process, inspection step, or handling requirement limits throughput.
This distinction is essential when calculating capacity for panelized production.
2.3 Takt Time
Takt time represents the production pace required to meet customer demand.
Takt Time = Net Available Production Time ÷ Required Output
Suppose a production shift provides 28,800 seconds of net available production time and the customer requires 3,600 boards during that period.
Takt time = 28,800 ÷ 3,600 = 8 seconds per board.
The manufacturing system must deliver an average of one board every eight seconds to meet that demand over the specified period.
Takt time is a demand-based target, not a machine specification. It should be compared with the effective throughput of the complete manufacturing process, taking into account panelization, scheduled breaks, planned downtime, product mix, and quality requirements.
2.4 Overall Equipment Effectiveness (OEE)
OEE measures how effectively planned production time is converted into good output. It combines three factors:
- Availability: The proportion of planned production time during which equipment is operating.
- Performance: Actual operating speed compared with the defined ideal production rate.
- Quality: The proportion of total output that meets quality requirements.
The standard relationship is:
OEE = Availability × Performance × Quality
For example, if availability is 90%, performance is 95%, and quality is 99%:
OEE = 0.90 × 0.95 × 0.99 = 84.65%.
OEE helps manufacturers identify losses caused by downtime, reduced operating speed, and defective output. However, comparisons between factories or production lines are meaningful only when their measurement methods, planned-time definitions, and production conditions are consistent.
A single OEE benchmark should not be treated as a universal standard for every SMT line. High-mix production, frequent changeovers, product complexity, and different equipment configurations can all affect achievable performance.
3. Identifying Bottlenecks in SMT Production Lines
A bottleneck is a process or resource that constrains the throughput of the overall production system. The bottleneck may change as product mix, equipment settings, staffing, and production schedules change.
The objective of bottleneck analysis is to identify the actual constraint, understand why it limits output, and determine whether improving it will increase finished-board throughput.
3.1 Solder Paste Printing
The stencil printer may constrain throughput when its complete operating cycle is slower than downstream processes.
The relevant cycle includes more than the printing motion itself. Depending on the equipment and production method, it may also include board handling, alignment, inspection requirements, stencil cleaning, and other interruptions.
Potential improvement measures include:
- Reviewing the complete print-and-transfer cycle
- Optimizing stencil cleaning and solder paste replenishment procedures
- Reducing avoidable setup and changeover time
- Evaluating inspection and handling requirements
- Monitoring print quality to prevent downstream defects and rework
Any cycle-time improvement must preserve solder paste printing quality and the requirements of the PCB design.
3.2 Pick-and-Place Equipment
Placement can become the main bottleneck when the PCB contains a large number of components, complex packages, or demanding placement requirements.
A machine's rated CPH may differ considerably from its actual production rate because component pickup, vision processing, head travel, feeder configuration, and placement accuracy all influence performance.
Capacity analysis should therefore use the actual BOM and placement program whenever possible.
Potential improvements include:
- Optimizing feeder allocation and component sequencing
- Reviewing nozzle selection and maintenance
- Reducing avoidable pickup errors and machine interruptions
- Balancing work between placement machines where the configuration permits
- Reviewing whether an additional machine or a different equipment configuration is justified
A faster placement machine will not necessarily increase finished output if printing, inspection, reflow, or another process remains the limiting constraint.
3.3 Reflow Soldering
Reflow soldering is another process that may constrain SMT throughput, particularly when placement capacity has been increased.

Unlike a simple stop-and-start machine cycle, a reflow oven processes boards continuously. Its effective throughput depends on oven length, conveyor speed, board spacing, PCB dimensions, thermal requirements, and the number of lanes available.
The required thermal profile must remain within the process window established for the solder paste, components, and PCB assembly.
Possible improvement measures include:
Measuring actual conveyor throughput under the approved thermal profile
Reviewing board spacing and handling arrangements
Evaluating whether a dual-lane configuration suits the product mix
Comparing oven throughput with the upstream and downstream processes
Validating any proposed changes through process trials and quality checks
A dual-lane oven may increase throughput when the existing oven is the actual bottleneck and the product and process requirements support parallel processing. The gain should be calculated from the equipment configuration and validated production data rather than assumed to be a fixed percentage.
3.4 Inspection and Testing
SPI, AOI, in-circuit testing (ICT), and functional circuit testing (FCT) can also constrain overall production capacity.
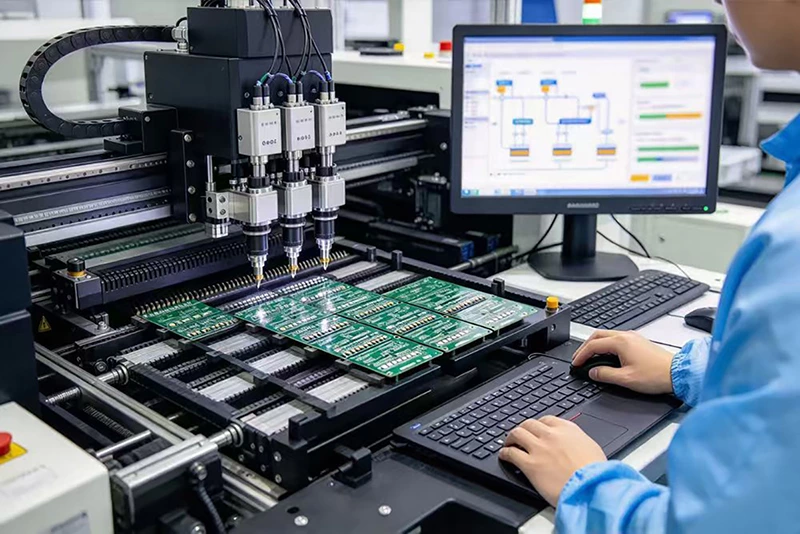
The impact depends on whether inspection or testing is performed inline, offline, or through parallel stations and fixtures.
For example, an offline functional test with a long test cycle may limit final output if only one test fixture is available. Adding parallel fixtures may improve effective throughput, provided that the additional equipment, operator availability, and test coverage meet the project requirements.
Capacity planning should include every process required to release a finished assembly, not just the SMT placement stage.
4. How to Calculate SMT Line Capacity: A Practical Method
A reliable capacity model should use measured or validated process data and a clearly defined output unit.
Step 1: Define the Production Requirement
Start by identifying:
- Required quantity of finished boards
- Delivery date and production window
- Number of shifts and net available production hours
- PCB dimensions and component count
- Product mix and expected changeovers
- Inspection, testing, and quality requirements
For example, a customer may require 20,000 boards per week across five production days. The required daily output is 4,000 boards, assuming the workload is distributed evenly.
Step 2: Map the Process and Measure Cycle Times
Record the relevant cycle time or throughput for each production stage, including:
- PCB loading and handling
- Solder paste printing
- Solder paste inspection
- Pick-and-place operations
- Reflow soldering
- Post-reflow AOI
- Required testing and final inspection
Do not compare cycle times without checking that they use the same unit. A placement machine may be measured in components per hour, an oven in boards per minute, and an AOI machine in boards per hour.
Convert these measurements into a consistent unit, such as boards per hour, before identifying the limiting stage.
Step 3: Calculate Theoretical Throughput
For a process that completes one board per cycle:
Theoretical Throughput = 3,600 ÷ Cycle Time in Seconds
For a process that completes multiple boards per cycle:
Theoretical Throughput = (3,600 ÷ Cycle Time in Seconds) × Boards per Cycle
Consider a simplified example in which the limiting process completes one board every 30 seconds:
3,600 ÷ 30 = 120 boards per hour.
If the process completes four boards per cycle under validated production conditions:
(3,600 ÷ 30) × 4 = 480 boards per hour.
These calculations describe the theoretical throughput of the specified process. The completed line's throughput may be lower because of other constraints, downtime, changeovers, inspection, testing, and quality losses.
Step 4: Estimate Effective Output
OEE can be used to estimate effective output when the theoretical production rate and OEE measurement are defined consistently.
Estimated Effective Output = Theoretical Throughput × OEE
For example, assume a line has a theoretical throughput of 120 boards per hour and a representative OEE of 75%.
Estimated effective output = 120 × 0.75 = 90 good boards per hour.
This is a simplified planning estimate, not a guarantee of actual output. If the cycle-time data already includes downtime or other losses, applying OEE without adjusting the calculation can count the same losses twice. Likewise, quality losses should not be applied twice if the output rate already represents good boards.
For more accurate planning, use production records from comparable products and verify the measurement basis.
Step 5: Compare Capacity with Customer Demand
Suppose the customer requires 100 good boards per hour, while the model estimates effective output at 90 good boards per hour.
The capacity gap is:
100 − 90 = 10 boards per hour.
The next step is to determine whether the gap can be closed through process improvement, reduced changeover time, better material availability, additional production hours, parallel equipment, or a revised production schedule.
The correct solution depends on the source of the constraint. Purchasing a faster placement machine will not solve a shortage caused by insufficient test capacity or a reflow bottleneck.
Step 6: Validate the Proposed Configuration
Before committing to a major equipment investment, validate the capacity model against actual production data wherever possible.
Review:
- The measured cycle time of the limiting process
- Available production time and shift arrangements
- Product mix and changeover frequency
- Expected yield and rework requirements
- Material availability and feeder preparation
- Downstream inspection and testing capacity
- The expected output under the proposed configuration
Capacity estimates should be updated when the product design, production mix, equipment configuration, or operating schedule changes.
5. Line Balancing for High-Volume PCBA Production
Line balancing aims to distribute work across production resources so that one stage does not create avoidable waiting time or restrict the output of the complete line.
In SMT manufacturing, placement workload can vary significantly depending on component count, package type, placement accuracy, and machine capability.
For example, one machine may handle many small passive components at high speed, while another handles complex ICs, connectors, or components that require specialized placement capabilities. If the workload is not balanced, one machine may finish early while another determines the overall cycle time.
Potential line-balancing measures include:
- Reviewing placement programs and feeder assignments
- Allocating components according to machine capability
- Reducing avoidable head movement and setup delays
- Improving changeover planning
- Evaluating alternative machine configurations
- Confirming that changes maintain placement quality and process stability
Line balancing should be based on actual program data and machine performance. Moving components between machines is not always possible because of package compatibility, equipment capability, accuracy requirements, and production constraints.
The objective is to improve the throughput of the complete line, not simply maximize the speed of one machine.
6. Improving OEE Before Investing in Additional Equipment
Before purchasing additional equipment, manufacturers should assess whether existing capacity is being lost through downtime, reduced operating speed, or quality problems.
OEE provides a structured way to investigate these losses.
6.1 Reduce Availability Losses
Availability losses can arise from equipment faults, feeder issues, material shortages, changeovers, maintenance, and other interruptions.
Possible measures include:
- Preparing feeders and materials before scheduled changeovers
- Standardizing setup and changeover procedures
- Scheduling preventive maintenance
- Monitoring recurring equipment faults
- Improving material replenishment and production coordination
Changeover reduction methods, including Single-Minute Exchange of Die (SMED) principles, may help shorten setup time when they are adapted to the actual SMT process.
The objective is to recover usable production time without compromising setup verification or quality checks.
6.2 Reduce Performance Losses
Performance losses occur when equipment operates below its defined ideal rate.
Potential causes include component pickup errors, feeder problems, nozzle wear, repeated vision attempts, and inefficient placement programs.
Manufacturers can investigate these losses through machine records, maintenance data, placement-program analysis, and recurring fault reports.
Improvement activities should target verified causes rather than rely on generic speed settings that may affect placement quality.
6.3 Reduce Quality Losses
Defects and rework consume capacity that could otherwise be used for good production.
Relevant improvement measures may include:
- Optimizing solder paste printing
- Monitoring placement accuracy
- Reviewing reflow profiles
- Analyzing SPI and AOI defect trends
- Investigating recurring component or process failures
- Implementing corrective and preventive actions
For high-volume programs, small changes in yield can affect the number of good boards delivered. However, the production impact should be calculated from actual output, defect classification, rework time, and scrap data.
Improving first-pass yield can increase effective capacity while reducing rework and quality-related costs.
7. Panelization Strategy for SMT Throughput
Panelization combines multiple PCBs into a larger panel for manufacturing. Depending on the design and process, this can increase the number of boards processed during a production cycle.
For example, a panel containing four identical boards may allow the printer and placement equipment to process more boards per cycle than a single-board configuration.
However, a four-up panel does not automatically produce four times the finished-board throughput across the entire manufacturing process. Actual gains depend on:
- PCB dimensions and panel layout
- Equipment working-area and conveyor limits
- Placement time and component distribution
- Solder paste printing and inspection requirements
- Reflow process constraints
- Depaneling method and downstream testing
- Board warpage, mechanical stress, and quality requirements
Panelization should therefore be evaluated at the complete process level. The panel design must meet manufacturing requirements and be validated for soldering, inspection, handling, and depaneling.
When the design and equipment are compatible, panelization may improve throughput without requiring additional SMT equipment. The expected benefit should be confirmed through engineering analysis or production trials.
8. Scaling from One SMT Line to Multiple Lines
When production demand exceeds the practical capacity of one line, manufacturers may need to allocate work across multiple lines or production shifts.
Multi-line planning introduces additional considerations beyond individual machine speed.
8.1 Shared Resources
Inspection equipment, testing fixtures, programming stations, and material preparation resources may serve more than one SMT line.
If these shared resources cannot process the combined output of all lines, they may become the system bottleneck. Capacity planning should account for their cycle times, utilization, queues, and availability.
8.2 Product Allocation and Changeovers
Assigning products to production lines requires consideration of board dimensions, equipment capability, component mix, tooling, and changeover requirements.
Grouping compatible products can reduce unnecessary setup changes, but the final schedule must also reflect customer priorities, material readiness, and delivery commitments.
8.3 Material and Feeder Management
High-mix production requires accurate control of components, reels, feeders, and material locations.
Shortages or incorrect feeder setups can interrupt production even when equipment capacity is available. Clear material identification, replenishment procedures, and setup verification help reduce these interruptions.
8.4 Production Data and Capacity Visibility
Production tracking systems can help manufacturers monitor output, downtime, defects, and work-order progress.
The value of these systems depends on data accuracy, integration, and how consistently the information is used in production decisions. Capacity visibility should support practical decisions such as work allocation, bottleneck investigation, and delivery planning.
9. How to Evaluate an EMS Partner's SMT Capacity
When selecting an EMS partner for high-volume PCBA production, buyers should evaluate both stated manufacturing capacity and the supplier's ability to deliver the specific product reliably.
The following questions can help establish whether a supplier's capacity claims are relevant to the proposed project.
9.1 What Is the Actual Placement Capacity?
Ask the supplier to clarify its placement capacity and how the figure is measured.
A placement figure expressed in components per month is different from the number of completed PCBs produced per month. The number of components on each board, the production mix, and the process configuration all influence the relationship between placements and finished units.
9.2 Can the Supplier Estimate Capacity for Your PCB Design?
Ask how the supplier evaluates the BOM, component packages, PCB dimensions, placement requirements, and expected production schedule.
A project-specific estimate is more useful than a general machine-speed figure because it reflects the actual assembly requirements.
9.3 How Are Production Bottlenecks Identified?
Ask how the supplier measures cycle times and determines whether printing, placement, reflow, inspection, testing, or another resource limits output.
The supplier should be able to explain the assumptions behind its estimate and identify the factors that could affect the final production rate.
9.4 How Are Quality and Rework Managed?
Review the supplier's relevant quality-control processes, inspection and testing requirements, defect reporting, and corrective-action practices.
Production capacity is useful only when it can be achieved while meeting the product's agreed quality requirements.
9.5 How Is Delivery Capacity Planned?
Discuss production scheduling, material readiness, changeover requirements, available shifts, and how the supplier responds to changes in demand.
For recurring programs, ask how capacity and delivery commitments are reviewed when forecasts or product specifications change.
9.6 Can the Supplier Support Your Expected Production Volume?
Ask for a capacity assessment based on your actual product and forecast. Where appropriate, request supporting information about comparable production programs, quality performance, and delivery history.
A credible assessment should explain how the supplier translates available manufacturing resources into expected output for your specific PCBA project.
10. TECOO's SMT Manufacturing Capacity
TECOO operates 8 production lines with a monthly placement capacity of 48.2 million component placements, supporting its PCBA manufacturing operations.
When evaluating a manufacturing partner, buyers should distinguish between component placement capacity and finished-board output. A monthly placement figure describes the volume of component placements that can be supported under the relevant operating assumptions; it does not mean the same number of finished PCBs can be produced.
The output achievable for an individual project depends on factors such as:
- The number and types of components on each PCB
- PCB dimensions and panelization
- Placement accuracy and process requirements
- Production scheduling and product mix
- Inspection, testing, and quality requirements
For customers planning a new PCBA program or scaling an existing product, the most useful next step is to evaluate the manufacturing requirements alongside the available production resources.
By defining the BOM, PCB design, forecast volume, quality requirements, and target delivery schedule, TECOO can assess the key factors that influence production planning for the project.
Planning a high-volume PCBA project? Contact TECOO to discuss your PCB design, production forecast, and manufacturing requirements.
Frequently Asked Questions
1. What is SMT line capacity planning?
SMT line capacity planning is the process of estimating production output, identifying bottlenecks, and allocating equipment and operating time to meet customer demand. It considers process cycle times, product complexity, changeovers, quality requirements, and actual equipment performance.
2. What is the difference between CPH and UPH?
CPH measures component placements per hour, usually as a pick-and-place equipment metric. UPH measures completed units per hour. The relationship between them depends on the number of components per board, placement performance, and the throughput of the complete manufacturing process.
3. How do you calculate SMT production capacity?
A simplified theoretical calculation is 3,600 divided by the cycle time in seconds, multiplied by the number of boards completed per cycle. Effective output must then account for applicable production losses without double-counting downtime, speed losses, or quality losses.
4. What is takt time in PCBA manufacturing?
Takt time is the net available production time divided by the required output. It indicates the average production pace needed to meet customer demand over a specified period.
5. Does a faster pick-and-place machine always increase SMT line output?
No. If another stage, such as printing, reflow, inspection, or testing, is the bottleneck, a faster placement machine may not increase the output of the complete line. Capacity planning should identify the actual constraint before equipment investments are made.
6. How can OEE improvement increase production capacity?
OEE analysis helps identify losses related to availability, performance, and quality. Addressing verified causes such as equipment interruptions, inefficient changeovers, reduced operating speed, and defects can increase effective output without necessarily adding new equipment.
7. Does panelization always increase PCBA production throughput?
No. Panelization can increase the number of boards processed per cycle, but the benefit depends on PCB design, equipment capability, inspection requirements, reflow constraints, and depaneling. The complete process must be evaluated before estimating the gain.
8. How should I evaluate an EMS partner's production capacity?
Review the supplier's project-specific capacity estimate, placement and assembly capabilities, bottleneck analysis, quality-control practices, production scheduling, and delivery history. Ask the supplier to explain how its capacity figures apply to your actual PCB design and production forecast.
Conclusion
SMT line capacity planning is more than a comparison of machine specifications. Reliable planning requires a clear definition of customer demand, consistent capacity calculations, accurate cycle-time measurements, and an understanding of the constraints that affect the complete manufacturing process.
CPH helps describe placement capability, UPH measures unit output, takt time connects production pace to demand, and OEE helps identify losses in the production system. Together, these metrics provide a practical framework for evaluating throughput, balancing production resources, and making informed equipment decisions.
For high-volume PCBA programs, the most effective capacity strategy is based on the actual product design, validated process data, and realistic production assumptions. Working with an EMS partner that can explain its capacity methodology helps buyers make better sourcing decisions and plan for more predictable production.
With 8 production lines and a monthly placement capacity of 82.368 million points, TECOO provides a manufacturing foundation for PCBA projects requiring substantial component placement volume. The next step is to assess how the specific PCB design, quality requirements, and production forecast align with the available manufacturing resources.
Contact TECOO to discuss your PCBA manufacturing requirements and production planning needs.